Welcome to this week’s publication of the Market’s Compass Crypto Sweet Sixteen Study #131. The Study tracks the technical condition of sixteen of the larger market cap cryptocurrencies. Every week the Studies will highlight the technical changes of the 16 cryptocurrencies that I track as well as highlights on noteworthy moves in individual Cryptocurrencies and Indexes. Both free and paid subscribers will receive this week’s unabridged Market’s Compass Crypto Sweet Sixteen Study sent to their registered e-mail. Happy Easter! Past publications can be accessed by paid subscribers via The Market’s Compass Substack Blog. Free subscribers should consider becoming a paid subscriber considering that the cost is a pittance at $10 a month or $100 a year for the full unabridged version.
The Excel spreadsheet below indicates the weekly change in the objective Technical Ranking (“TR”) of each individual Cryptocurrency. The technical ranking system is a quantitative approach that utilizes multiple technical considerations that include but are not limited to trend, momentum, measurements of accumulation/distribution and relative strength. The TR of each individual Cryptocurrency can range from 0 to 50. The primary take-away from this spread sheet should be the trend of the individual TRs, either the continued improvement or deterioration, as well as a change in direction. Secondarily, a very low ranking can signal an oversold condition and very high number can be viewed as overbought. Thirdly, the weekly TRs are a valuable relative strength/weakness indicator vs. each other, in addition when the Sweet Sixteen Total Technical Ranking (“SSTTR”), that has a range of 0 to 800 is near the bottom of its range and an individual cryptocurrency has a TR that remains elevated it speaks to relative strength and if the SSTTR is near the top of its recent range and an individual cryptocurrency has a TR that remains mired at low levels it speaks to relative weakness. Lastly, I view the objective Technical Rankings as a starting point in my analysis and not the entire “end game”.
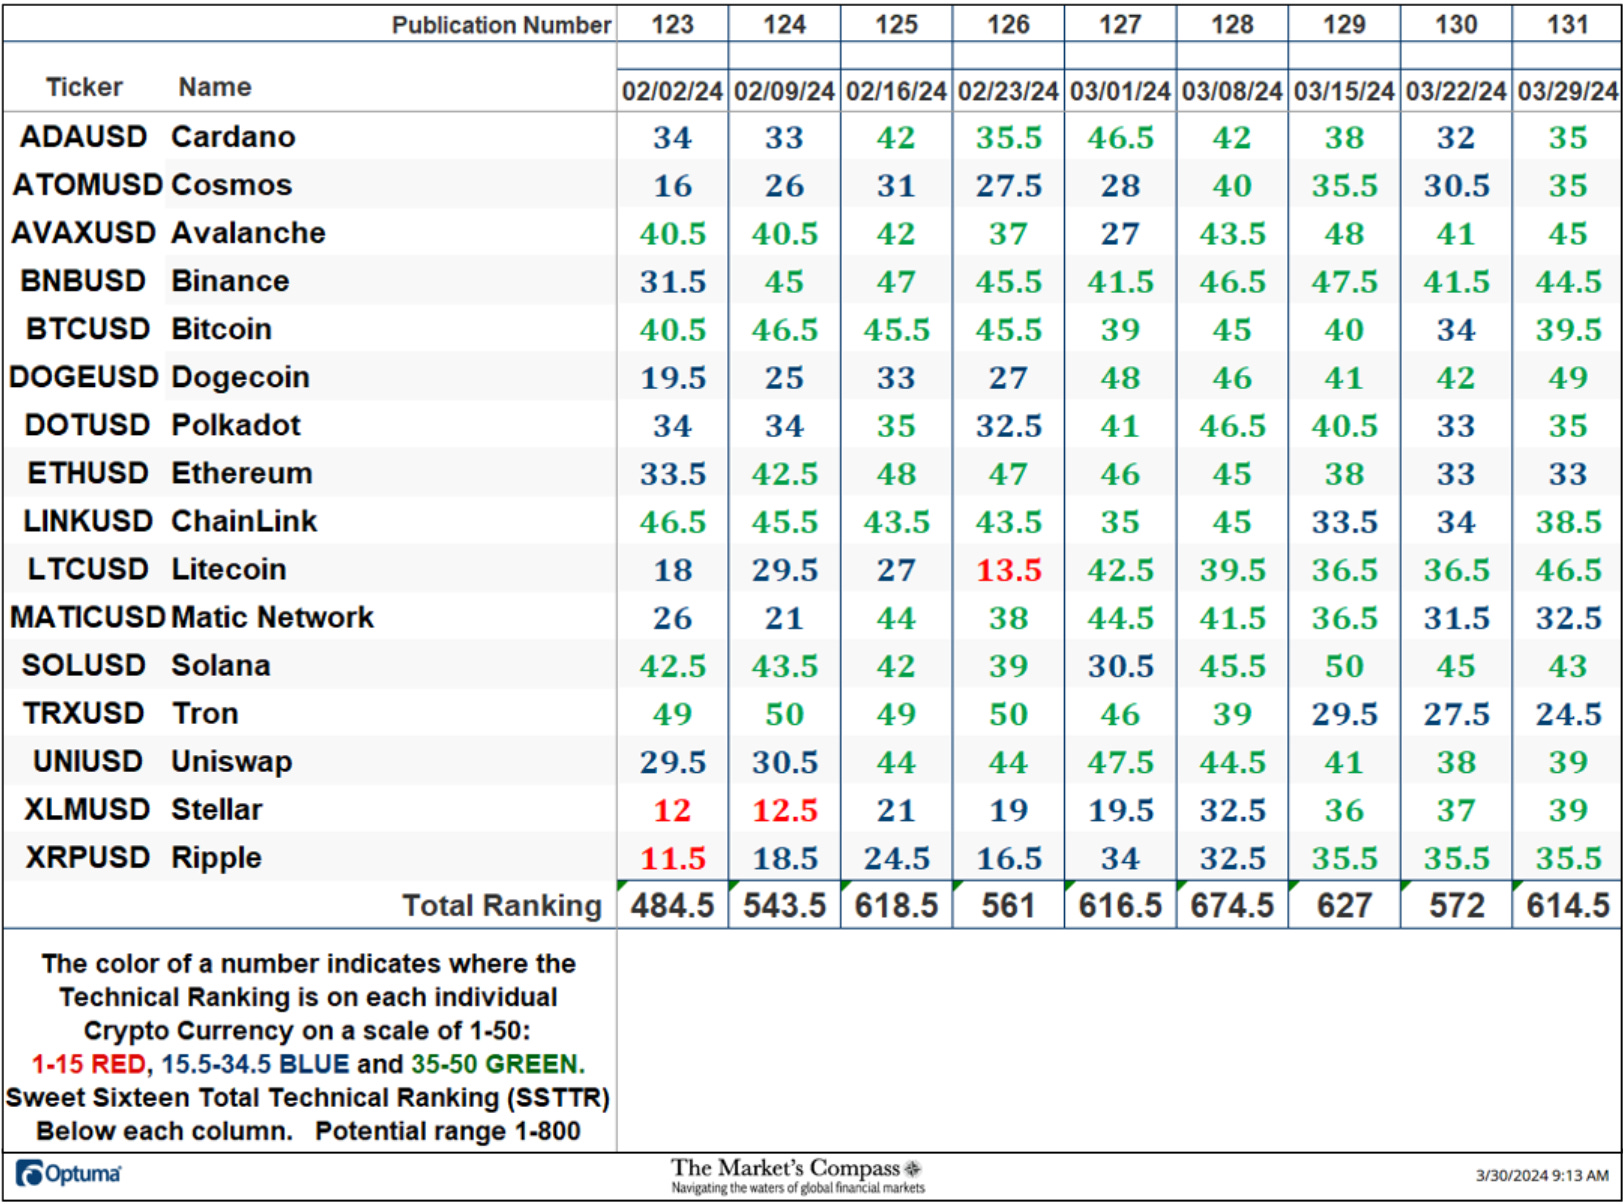
*Rankings are calculated up to the week ending Friday March 29th
The SSTTR rose 7.43% to 614.5 last week from 572 for the week ending March 22nd which was a -8.77% drop in SSTTR from the week before that.
Twelve of the Sweet Sixteen Cryptocurrencies registered gains in their individual TRs, two fell, and two were unchanged. The average TR gain was +2.66 versus the previous week’s average TR loss of -3.44. Thirteen of the Sweet Sixteen ended the week in the “green zone” (TRs between 35 and 50) and three were in the “blue zone” (TRs between 15.5 and 34.5) and none were in the “red zone” (TRs between 0 and 15). The week before there were eight in the “green zone” and eight were in the “blue zone”.
*The CCi30 Index is a registered trademark and was created and is maintained by an independent team of mathematicians, quants and fund managers lead by Igor Rivin. It is is a rules-based index designed to objectively measure the overall growth, daily and long-term movement of the blockchain sector. It does so by indexing the 30 largest cryptocurrencies by market capitalization, excluding stable coins (more details can be found at CCi30.com).
The Relative Rotation Graph, commonly referred to as RRGs were developed in 2004-2005 by Julius de Kempenaer. These charts are a unique visualization tool for relative strength analysis. Chartists can use RRGs to analyze the relative strength trends of several securities against a common benchmark, (in this case the CCi30 Index) and against each other over any given time period (in the case below, daily since the end of the previous week). The power of RRG is its ability to plot relative performance on one graph and show true rotation. All RRGs charts use four quadrants to define the four phases of a relative trend. The Optuma RRG charts uses, From Leading (in green) to Weakening (in yellow) to Lagging (in pink) to Improving (in blue) and back to Leading (in green). True rotations can be seen as securities move from one quadrant to the other over time. This is only a brief explanation of how to interpret RRG charts. To learn more, see the post scripts and links at the end of this Blog.
Not all sixteen cryptocurrencies are plotted in this RRG Chart. I have done this for clarity purposes. Those of higher technical interest remain.
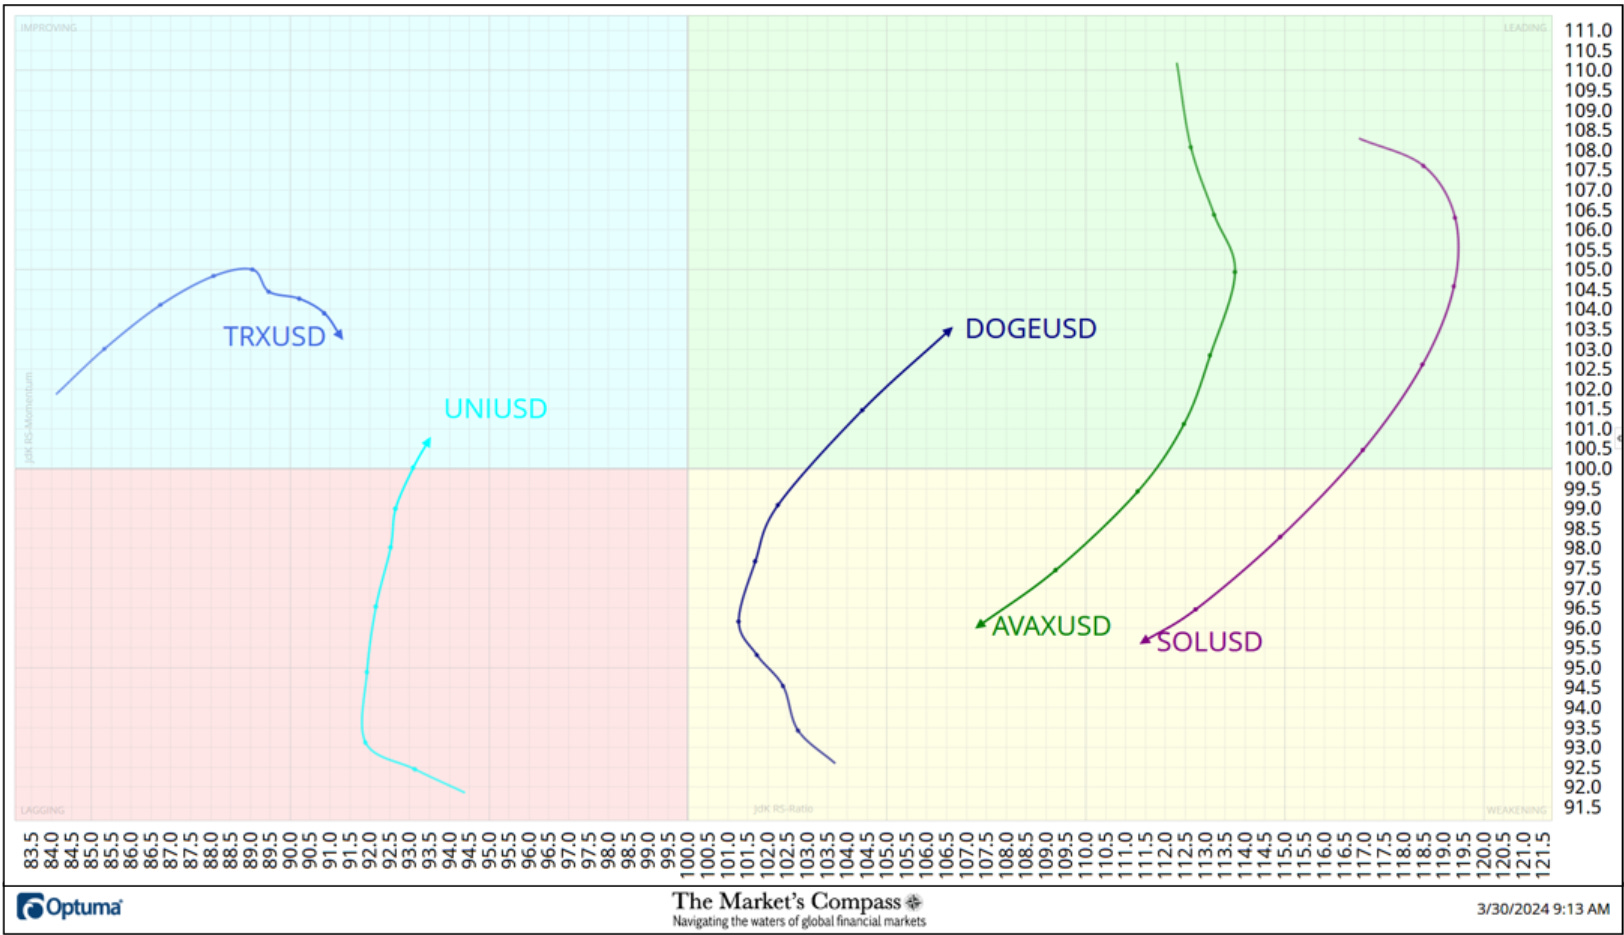
Both Avalanche (AVAX) and Solana (SOL) had begun to roll over in the Leading Quadrant the week before last and in doing so gave advance warning that AVAX and SOL were starting to lose Relative Strength Momentum. Both have followed through to the downside and late last week they fell into the Weaking Quadrant. Dogecoin (DOGE) has risen out of the Weakening Quadrant and going into the end of last week DOGE began to exhibit positive Relative Strength and Relative Strength Momentum vs. the CCi30 Index as it entered the Leading Quadrant. At the beginning of last week Tron (TRX) was rising in the Improving Quadrant but it has rolled over losing upside Relative Strength Momentum. Uniswap (UNI) has left the Lagging Quadrant behind and has just entered the Improving Quadrant.
*Friday March 22nd to Friday March 29th.
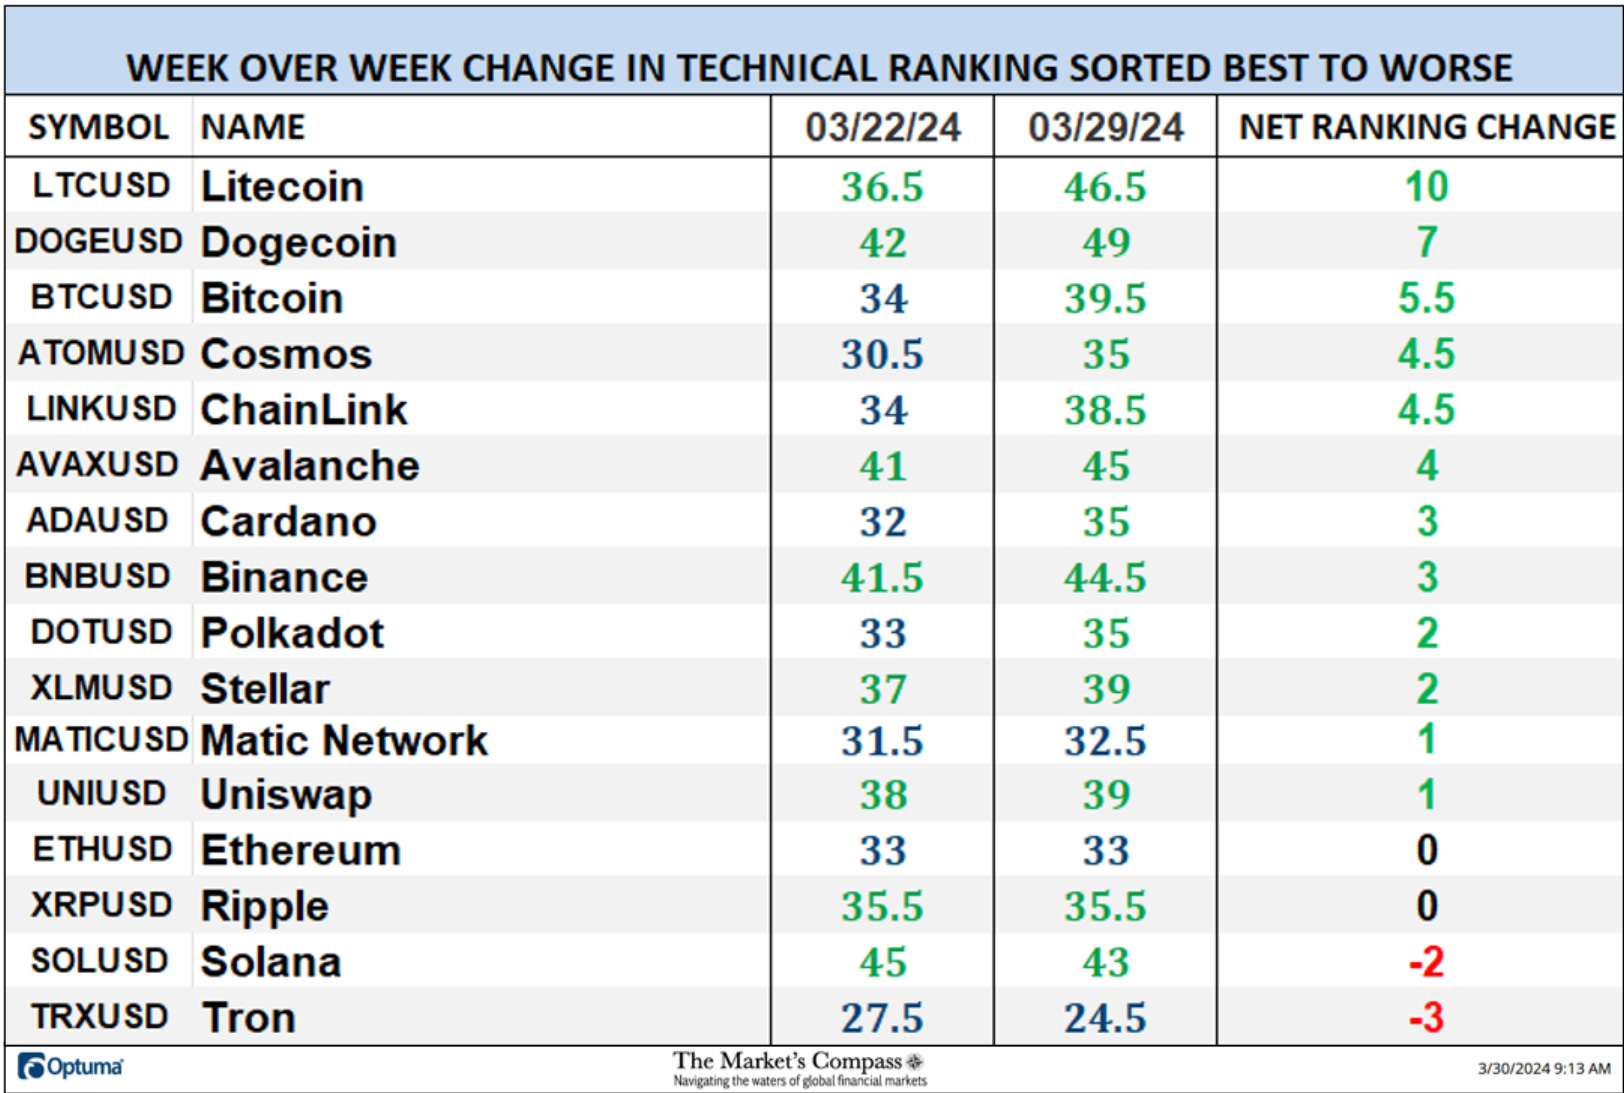
Fifteen of the Sweet Sixteen registered absolute gains last week with only Ethereum (ETH) losing ground. The seven-day average absolute gain was +13.19% reflecting the broad based rebound in the Cryptocurrency market with both Dogecoin (DOGE) and Litecoin (LTC) leading the pack higher. That was versus an average absolute loss of -9.22% the week before when all of the Sweet Sixteen lost ground.
There are eight Technical Condition Factors (“TCFs”) that determine individual TR scores (0-50). Each of these 8, ask objective technical questions (see the spreadsheet posted below). If a technical question is positive an additional point is added to the individual TR. Conversely if the technical question is negative, it receives a “0”. A few TCFs carry more weight than the others, such as the Weekly Trend Factor and the Weekly Momentum Factor in compiling each individual TR of each of the 16 Cryptocurrencies. Because of that, the excel sheet below calculates each factor’s weekly reading as a percent of the possible total. For example, there are 7 considerations (or questions) in the Daily Momentum Technical Condition Factor (“DMTCF”) of the 16 Cryptocurrencies ETFs (or 7 X 16) for a possible range of 0-112 if all 16 had fulfilled the DMTCF criteria the reading would be 112 or 100%. A DMTCF reading at 85% and above suggests a short-term overbought condition is developing and a reading of 15% and below suggests a short-term oversold condition.
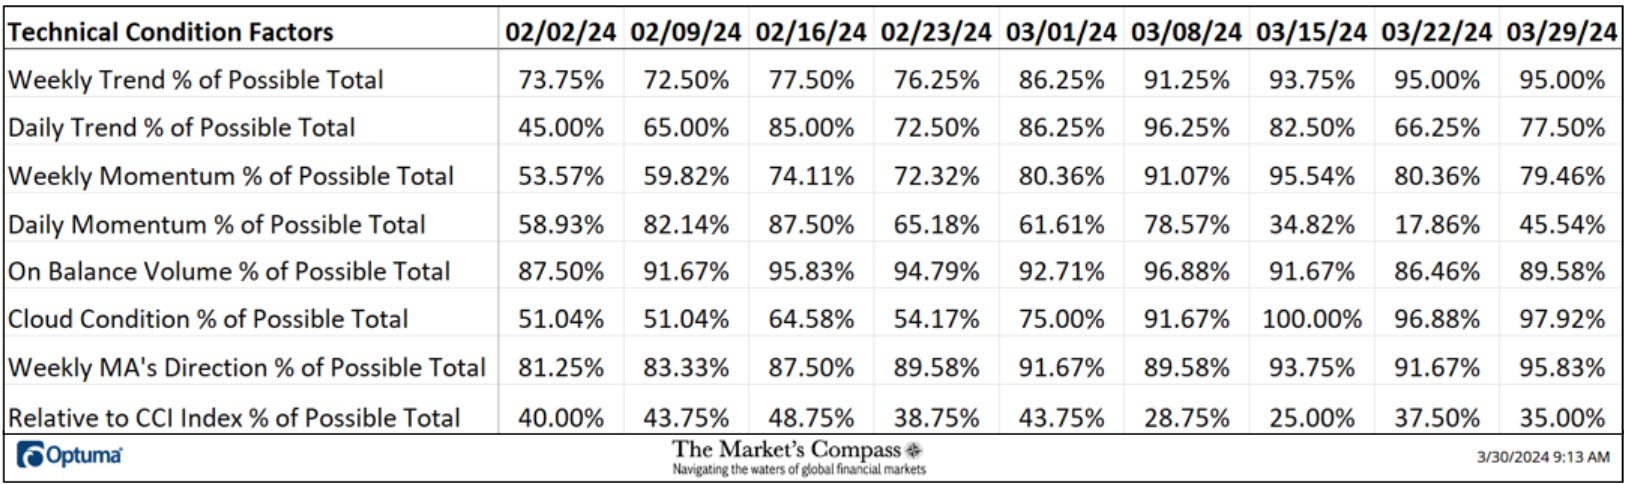
At the end of last week, the DMTCF rose to 45.54% or 81 from the near over sold reading of 17.86% or 20 from the week before.
As a confirmation tool, if all eight TCFs improve on a week over week basis, more of the 16 Cryptocurrencies are improving internally on a technical basis, confirming a broader market move higher (think of an advance/decline calculation). Conversely, if more of the TCFs fall on a week over week basis, more of the “Cryptos” are deteriorating on a technical basis confirming the broader market move lower. Last week five TCFs rose, two fell, and one was unchanged.
The Sweet Sixteen Total Technical Ranking (“SSTTR”) Indicator is a total of all 16 Cryptocurrency rankings and can be looked at as a confirmation/divergence indicator as well as an overbought / oversold indicator. As a confirmation/divergence tool: If the broader market as measured by the CCi30 Index continues to rally without a commensurate move or higher move in the SSTTR the continued rally in the CCi30 Index becomes increasingly in jeopardy. Conversely, if the CCi30 Index continues to print lower lows and there is little change or a building improvement in the SSTTR a positive divergence is registered. This is, in a fashion, is like a traditional A/D Line. As an overbought/oversold indicator: The closer the SSTTR gets to the 800 level (all 16 Cryptocurrencies having a TR of 50) “things can’t get much better technically” and a growing number individual Crypto’s have become “stretched” there is more of a chance of a pullback in the CCi30. On the flip side the closer to an extreme low “things can’t get much worse technically” and a growing number of Crypto’s are “washed out technically” and an oversold rally or measurable low is closer to being in place. The 13-week exponential moving average in Red smooths the volatile SSTTR readings and analytically is a better indicator of trend.
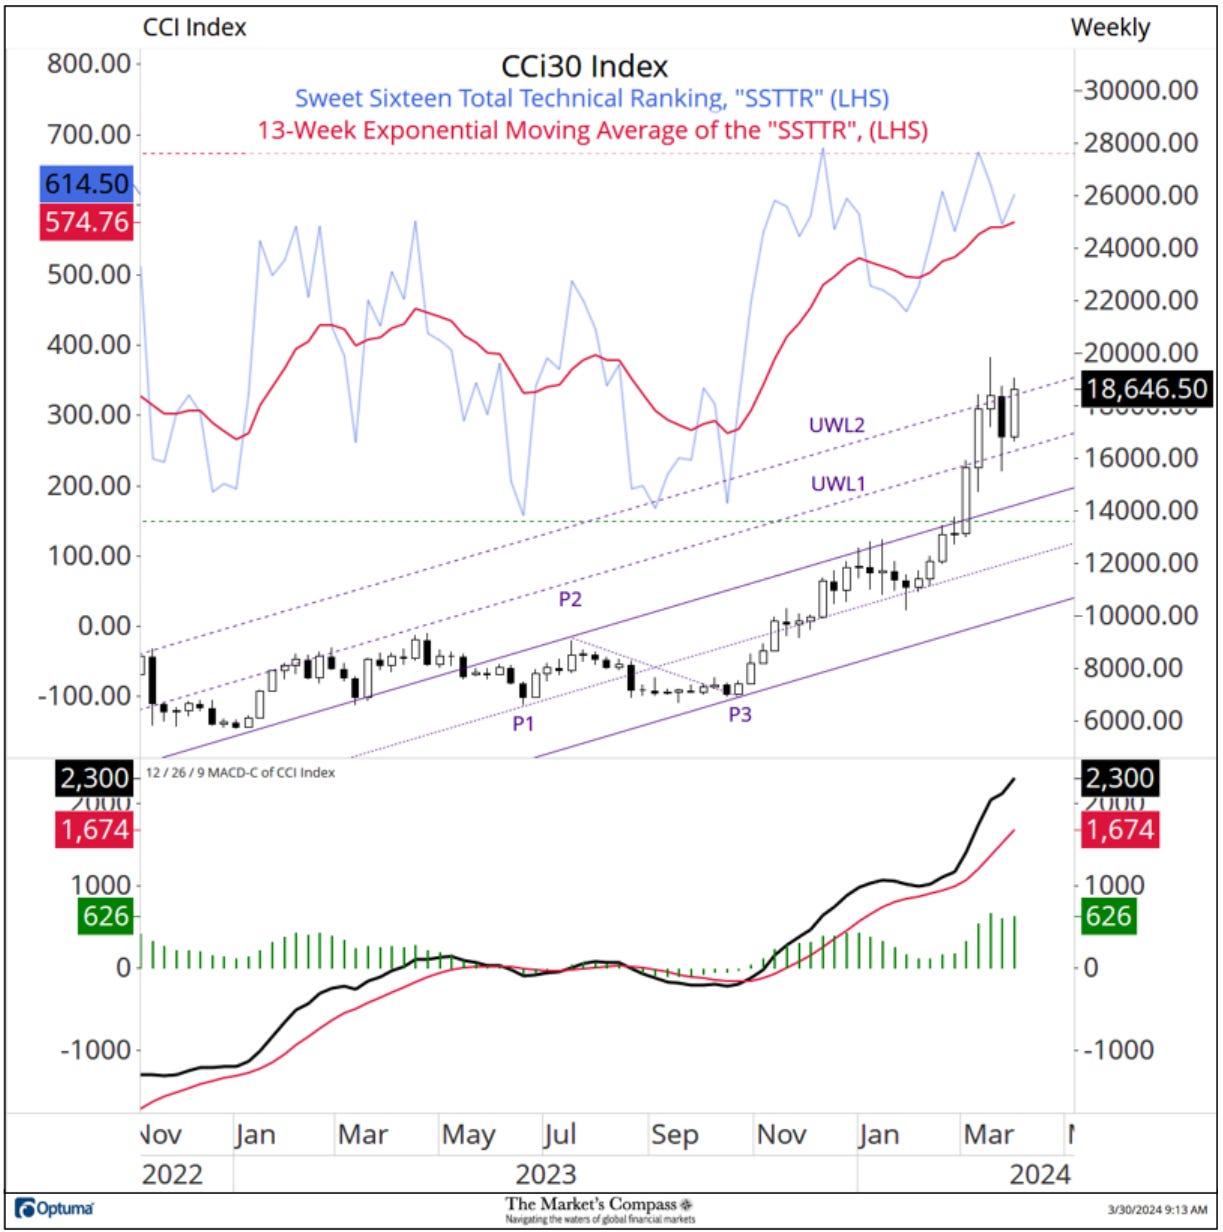
Last week the CCi30 Index took another stab at resistance at the Upper Warning Line 2 (violet UWL2) of the Standard Pitchfork (violet P1 through P3). Last week’s Candle, although not a “perfect” Engulfing Candlestick pattern it nonetheless speaks to a strong reversal of the previous week’s price action. MACD remains above it signal line and it has begun to re-accelerate higher reflecting the resurgence of upside price momentum. The Sweet Sixteen Total Technical Ranking (SSTTR) has bounced from support at the 13-Week Exponential Moving Average and although it is elevated in its range, I think it would premature to declare it a warning signal.
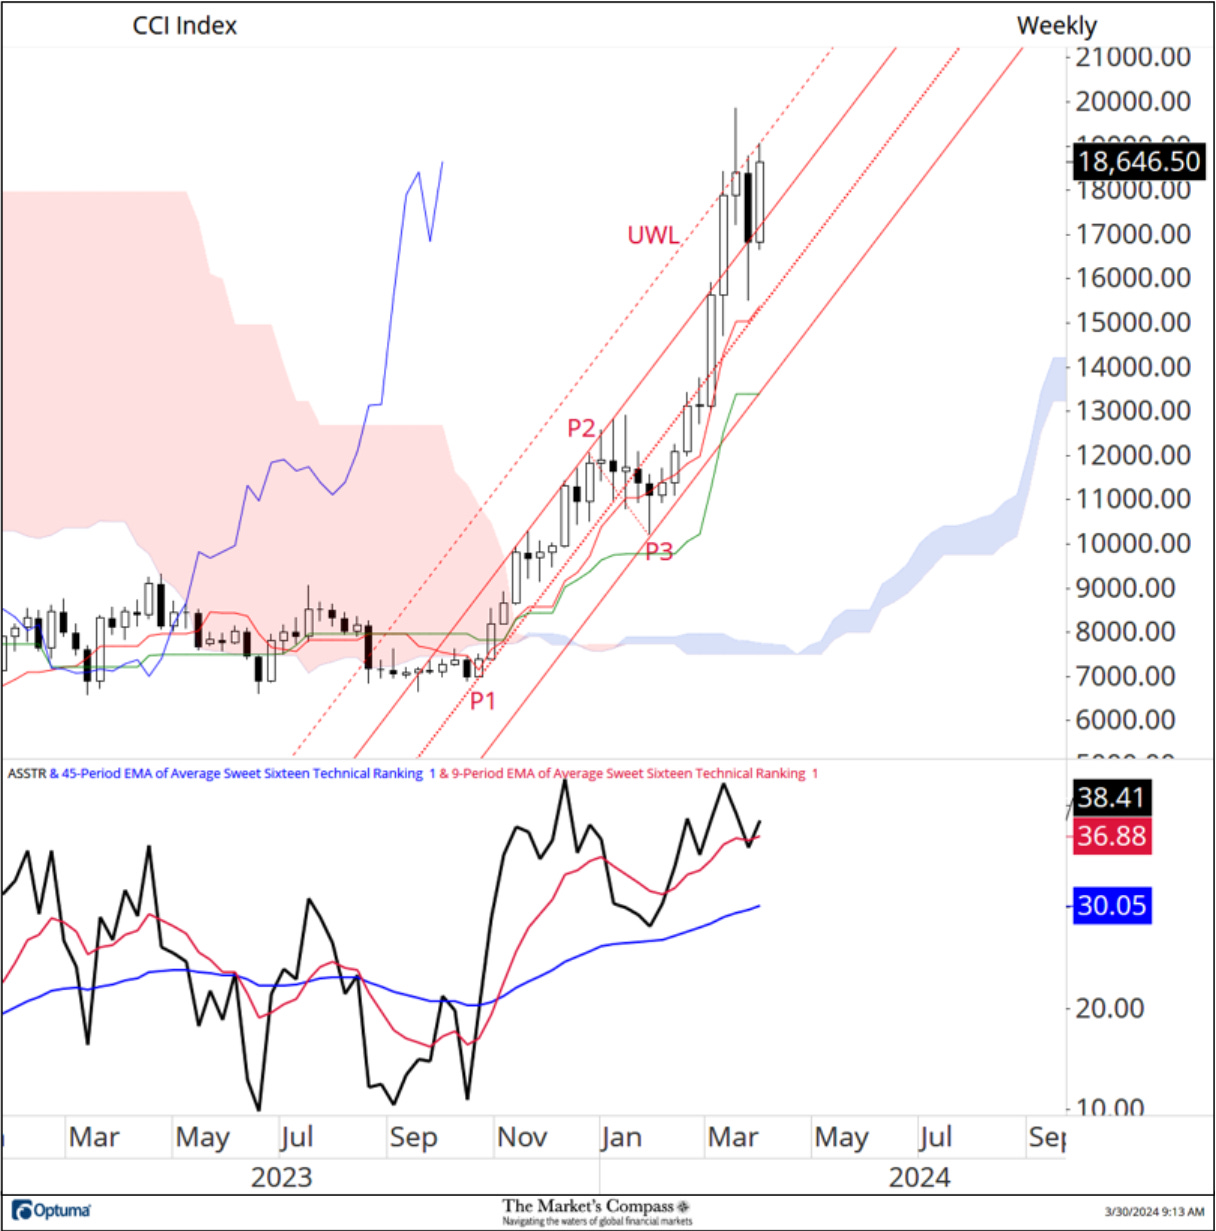
*The Average Sweet Sixteen Technical Ranking (“ASSTR”) is the average of the individual TRs of the sixteen cryptocurrencies we track at the end of each week.
I had applied a shorter-term Standard Pitchfork (red P1 through P3) to the Weekly Chart above when the index rallied above the January highs. The Upper Warning Line (red UWL) of the Standard Pitchfork capped the rally on a closing basis three weeks ago. At that time the Average Sweet Sixteen Technical Ranking (“ASSTR”) had reached an extreme, signaling a potential overbought condition, giving fair warning that a price pullback would unfold and that’s what happened the week before last. That said, the CCi30 Index held support above the Upper Parallel (solid red line) on a closing basis. It may be that the index has “more work to do” consolidated the gains from the price pivot low at P3 but last week’s price action can only be considered positive.
I applied the Schiff Modified Pitchfork (gold P1 through P3) to the Daily Cloud Chart of the CCi30 Index after the price pivot higher a week ago last Wednesday at (P3). After a brief pullback, the rally followed through and last Monday the index overtook the Median Line (dotted gold line) and on a closing basis the index held above for the remainder of the week. The “early mover” Fisher Transform a week ago and now MACD is one good day from doing the same. In the days ahead I expect the CCi30 Index to challenge resistance at the Upper Parallel (solid gold line) of the Pitchfork.

*The Sweet Sixteen Index is an Index that is comprised of the sixteen larger cap Crypto Currencies we track in the Blog.
At the very start of March, the Sweet Sixteen Index broke out above the Upper Parallel (solid violet line) of the Schiff Modified Pitchfork (violet P1 through P3). After extending its gains MACD signaled an overbought condition and an Elliott Wave three wave pullback unfolded. My Sweet Sixteen Daily Momentum/Breadth Index (bottom panel) signaled an oversold condition and the index held support offered by the Upper Parallel of the Schiff Modified Pitchfork and prices have started to move higher again. I have added a second shorter term Standard Pitchfork (gold P1 through P3) and the index is tracking higher in the confines of the Lower Parallel (solid gold line and the Median Line (gold dotted line) of that shorter term Pitchfork. I suspect that higher prices are in the cards with the caveat that the 13 level holds as support.
The charts are courtesy of Optuma whose charting software enables anyone to visualize any data including my Objective Technical Rankings. Cryptocurrency price data is courtesy of Kraken.
The following links are an introduction and an in-depth tutorial on RRG Charts…
https://www.optuma.com/videos/introduction-to-rrg/
https://www.optuma.com/videos/optuma-webinar-2-rrgs/
To receive a 30-day trial of Optuma charting software go to…
A three part tutorial on Median Line Analysis AKA Andrews Pitchfork is available at my website…